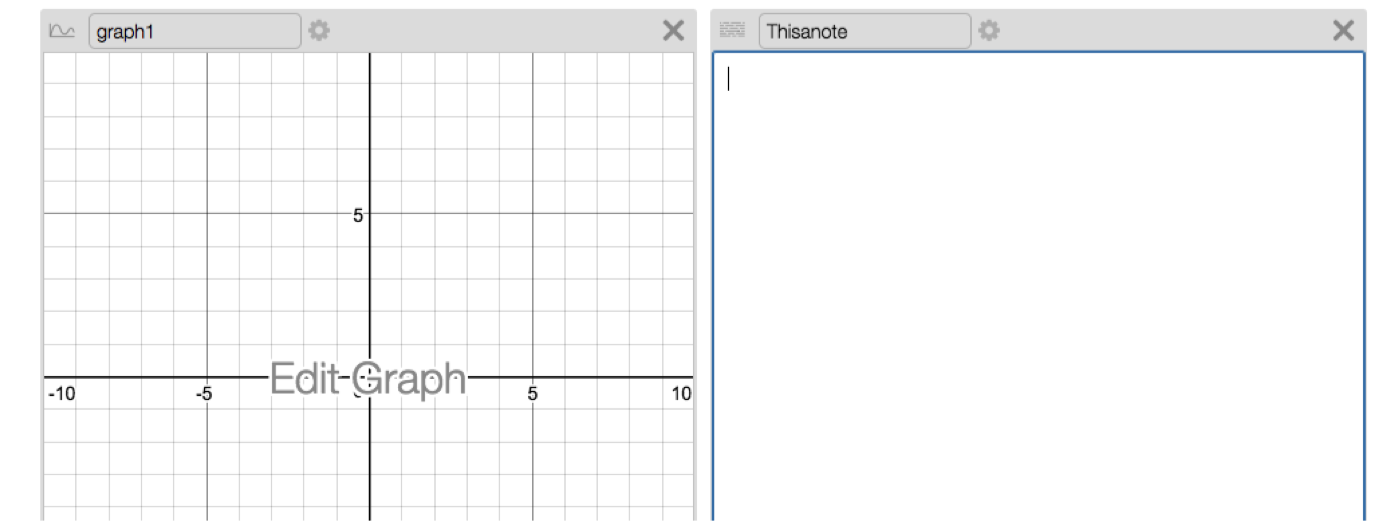
Challenge #1
You can name a component by typing it into the space on the left side of the component header. For example the graph here has been named graph1 and the note has been named Thisanote.
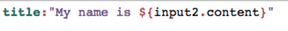
Challenge #2
- Name your input component. In this example I named the input "input1"
- In the title script use the sink "title"
- Put your text in quotations
- make sure you cite the input content by putting it in ${ }
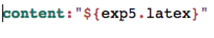
Challenge #3
- use the content sink in the note
- Write this the same way as you would the title. The only difference is is the "content" sink instead of the "title" sink

Challenge #4
- Sourcing something into another screen is the same as doing it into the same screen. Just reference the correct component
- In this example input4a is on the previous screen.

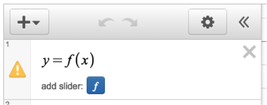
Challenge #5
- Don't forget to change the input type to math.
- Use ".latex" to copy the exact latex input a math expression into another component.
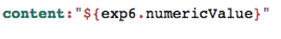
Challenge #6
- Change the input type to math
- in the content of the note, use ".numericValue" to display the numeric value of the expression after computation
- In order to hide the numeric value of the expression in the math input field use the following in the input script:
Challenge #7
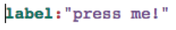
Changing the label of buttons is the same as changing content in a note or text in a title
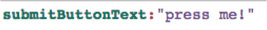
- For an action button use "label":
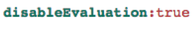
Challenge #8
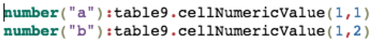
- In order to create a number, use cellNumericValue in the table
- cells are referenced as (row,column) with row 0 being the header.
- Here, row 1 column 1 becomes the first (x) coordinate and row 1 column 2 becomes the second (y) coordinate
- Backticks `` are used around the coordinate point to convert into mathtype but for simple expressions like points this is not necessary."

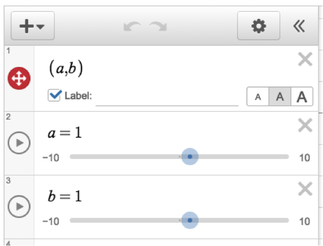
Challenge #9
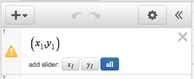
- Create two numbers in the graph by connecting them to cell numeric values in the script
|
|
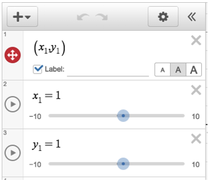
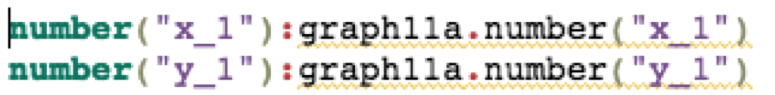
Challenge #10
|
|
- In the note, create the coordinates similarly to the method in challenge #8 except instead of referencing rows and columns, reference the "number" from the graph.
- If you are using subscript, make sure to put an underscore between the text and subscript. If your subscript is longer than one character you need to put { } around the text, i.e. "x_{11}"

- In order to put the coordinates into the table, assign one number to each cell
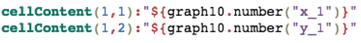
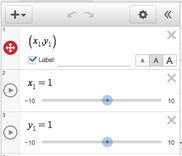
Challenge #11
This challenge serves mostly to show that you can copy numbers from one graph to another. The coordinate point is just there to act as a visual example. For a more advanced look at how to copy entire graphs from one screen to the next take a look at layers in the documentation.
|
|
- In the script for the second graph, create new numbers that are equal to the predecessors in the first graph
|
|
Challenge #12
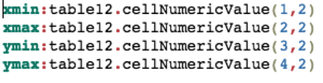
- You can adjust the min and max of each axis separately using the sinks xmin, xmax, ymin, and ymax. For a more advanced look at bounds take a look at the documentation.
- Here we are setting each bound to come from the values in a table. You may notice that they all reference column 2. In this case I typed each bound name into column 1 to make it easy to enter values into the correct cell.
- Type the following into your graph script
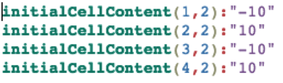
- In order for these window restrictions to work all four bounds must be defined. To make sure this happens from the start we can prepopulate text into the cell. You want to type this into the table script
Challenge #13
- In the graph script, use the "function" sink. Be sure to name the function
- You want to create a simple function using the latex from the math input. use simpleFunction( ) to make this happen.
- you can also use xYLine, but you can experiment with that on your own.

|
|