I am Mr Chow
  • Blog
  • Breakout! Desmos
  • Desmos Activities
  • Lessons

Learning Computation Layer: A (Less Foolish) Guide

10/11/2020

1 Comment

 
Hey there! With so many people taking their first steps in Computation Layer, I thought I would take a minute and give a little update. Two years ago I wrote the (aptly named) blogpost, A Fools Guide to Learning CL. If you read it, I apologize. If you didn't, Stop! There's a lot of new stuff in store for you.

 So much has changed over the last few years. Computation Layer is no longer a "labs" feature that needs to be turned on. The gear to add code now looks like this: </>. Activity Builder now allows you to add as many components as you want. For those of you looking to begin your CL journey in the new Desmos, I threw together a quick list of ways to get started

1. Find something that interests you. Learn that thing.

Start with a purpose in mind. Know what you want to make, whether it's getting your teacher dashboard to reflect correctness, giving students feedback, or just adding small things like unit measures or customized explain prompts. Having an idea for something will really help guide your next steps.

2. Copy a screen or two.

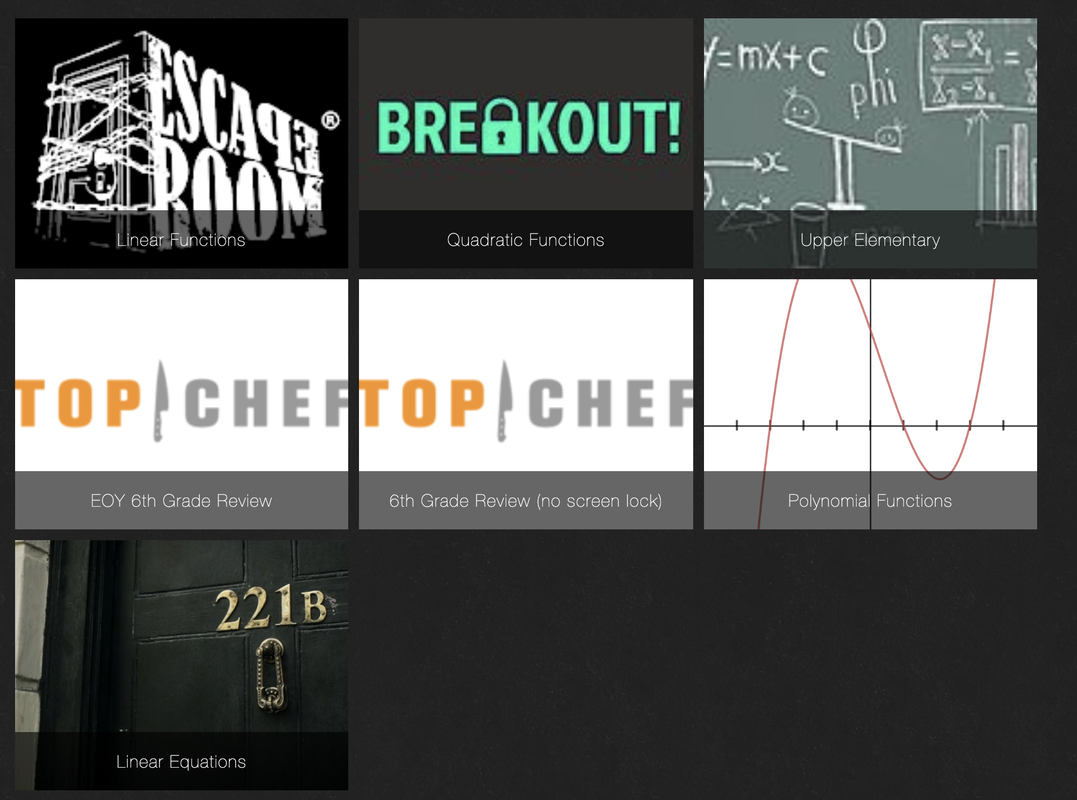
Has somebody created a version of the thing you want to learn? Is there an activity with an interaction you really like? Now that you can copy individual screens and paste them into your own activities, take examples from multiple sources, add them to a "workspace" activity, then dig into the code to see how they tick.

3. Get some help.

The Computation Layer Documentation is a great place to learn about the structure of CL, get a reference list of the available commands, and see some of the code in action.
Have a question you want answered or an idea you want to share? visit the CL forun at  cl.desmos.com

4. Do some self exploring.

​If you're ready to get started with your own learning, there's no place better to start than with one of our scavenger hunt activities. You can find the original scavenger hunts at bit.ly/cl-hunt and bit.ly/desmos-cl-hunt. For a little more fun, try our Rocket Scavenger Hunt. 

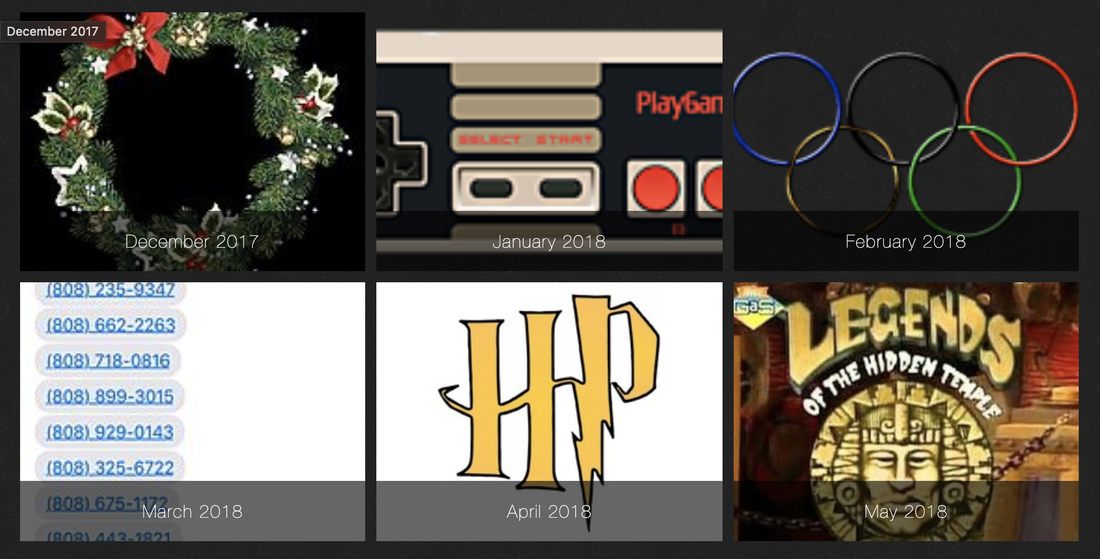
We also posted a series of webinars for you to learn from and write a monthly newsletter! If you have a minute to sit down and listen or sit down, read, and play. Check us out! 
  • Advanced Activity Building Webinar
  • Computation Layer Webinar Series
  • Sign up for our Newsletter

5. Join the community.

We host monthly CL challenges on twitter and through our Desmos Educators Facebook group. Follow along with #matchMyCL to join in on the fun and get access to all of the responses. 

Here For You

As you begin your CL journey, always remember that you can  reach out to us for help. Please feel free to reach out to me via email (jay@desmos.com or mrchowmath@gmail.com) or via twitter (@mrchowmath) and I would be more than happy to assist you. Good luck and happy building!

1 Comment

Rebooting the Franchise

7/1/2019

7 Comments

 
About a year and a half ago I made this thing and shared it with a few teachers to misbehave with during a Dan Meyer workshop:
Picture
People liked it, so I made a few more. 
Then I started work at Desmos and production STOPPED...

Read More
7 Comments

Statistics and the Activity Builder.

2/18/2019

5 Comments

 
So Desmos released a whole suite of new, super exciting statistics features on the graphing calculator and you're trying to think of the best ways to implement them into your next activity.

Statistics teachers: this thread is for you beautiful people. Tune in. pic.twitter.com/ROEoX7QqXA

— Desmos.com (@Desmos) February 6, 2019
You could open a graph screen and let students explore on their own, but then why make the effort to make it in activity builder? You could preload a dot plot, histogram, etc. into a half screen graph display and use CL to link in some data for students to enter, no harm in that, but don't you want to make full use of the ability to represent large amounts of data nicely and neatly? 

Use the aggregate function to collect student data from the entire class and display it on each student's computer.

Believe it or not, this can be done with one line of code in a graph component's CL script, but before we can get into it I'd like to take a quick look at how we can manipulate numbers in Desmos. This will just be a quick look into numbers and number lists so anyone with the know-how should feel free to skip ahead.

​We can use any input to take a a number and put it into a graph display. 
​
Here, I used firstDefinedValue to make sure that a dot appeared even when nothing was entered
Picture
but you can do it just as easily by making the number whatever is typed into the math input.
Picture
We can also represent numbers in lists, and its actually these lists that we use to build stuff with the new stats features:


We can make a number list with CL just like we did a number:
​
Again, some fancy extra stuff here to make sure your window bounds fit all of your data, but essentially it boils down to this:
Picture
Essentially, we ask CL to create a list and then build the scatter plot as if the list was built. When we run the activity, these two parts work together with the CL script providing the list and the graph component building the dot plot from the list.

Ok, on to aggregation

We said earlier that the way to build any of the new stats features is with a list. Wouldn't it be great if there were a function that did just that with numbers that students input? For that we have the aggregate function:
Picture
Ignore the red line here, he's cranky because he's incomplete. To complete this guy I need to put a number into aggregation. This can be any number thats a part of of an activity, not just a student input. If you've ever wondered how we do the "you have the highest score"/"at least one person has a higher score than you" display in activities like Point Collector: Lines, it uses aggregation. Here's how you complete it:
Picture
So we've taken numbers from each student and aggregated it, now it's time to make it into something.  Our stats tools require a list so let's finish this up:
Picture
This is essentially what aggregate does. It takes a number from each student and turns it into a list that we can use to make stuff. With this single line of CL we can take the inputs from different students and build a plot of class data.

What about bivariate data?

Bivariate data, e.g. scatter plots can be a little tricky to aggregate. Sure, we can make a list for each variable and plot the points using the two lists separately but depending on what type of input you're using you may run into trouble with x-values not matching their corresponding y-values. This is because of the way the data is gathered. In short, if you have students entering numbers one at a time, the computation layer will collect the information as it comes in. Therefore, if students enter coordinates out of order the x and y coordinates won't line up. 

The best way to work around this is to use a formula in the graph display to combine the two inputs, aggregate that combined value, and then use another formula to deconstruct the two coordinates. Unfortunately, there isn't a single formula that you can use in all cases and the method you choose will depend on the possible values that students will enter, mainly the number of digits and the number of decimal places. These methods vary but I've included an example that works for integral values between 0 and 99.  You can try it out as a student below (aggregation requires a class to pull the data from), but feel free to smash the copy and edit button here.

Note: ignore the CL script here, I added some extra precautions so that I can run this code without supervision. What you really want to look at is the expression list in the graph.

Resources:

 Last week I hosted a webinar with Desmos on this exact topic. Feel free to watch here:
https://cl.desmos.com/t/introduction-to-the-computation-layer-webinar-3/393
​

Here's the link again to the activity running throughout this post:
https://teacher.desmos.com/activitybuilder/custom/5c6a417407008410bf2144a2
​
​
As always, feel free to email ortweet me your questions or requests for clarification. Happy building!
5 Comments

Card Sorts: You asked,  Desmos Answered. Now What?

10/14/2018

10 Comments

 
The card sort component in the Desmos Activity Builder is awesome without question. It doesn't take a deep dive into twitter to see how many teachers have benefitted from the deep discussions and understanding these activities produce.

We love @Desmos card sort! #iteachmath @CajonValleyUSD @GreenfieldCVUSD @GThunderbirds pic.twitter.com/jM3S0K4b2Q

— Bessma Garmo (@BessmaGarmo) October 13, 2018

Reasoning card sort with a convince me prompt built in via @desmos Great way to Foster productive discourse about mathematics in a digital way! @PortsmouthHS_RI pic.twitter.com/d4Cbeh8CbJ

— Tim "Tech" Marum (@tmarum23) October 12, 2018
At it's core, the card sort is everything that is great about Desmos. It takes a classic activity, one that is already great on paper and uses the tech to make it better. Teachers can create each card by editing a graph via Desmos, by typing in math or text, or even by uploading their own image to the card. Answer keys can be created by dragging and dropping the correct cards together or can be left off to provide more open discussion. It's no wonder why the quality of the activities, combined with the efforts of champions like Cathy Yenca (twitter: @mathycathy) ​have led to an abundance of resources. Simply put, people love card sorts and LOVE building their own for their classrooms.

Hey #LearnFestATX... @Desmos Card Sorts are for EVERYONE! Don't believe me? Come to the Shrieking Shack at 2:45 to learn more! YOU! Yes, YOU! @TheLearnFest pic.twitter.com/DRG38n7Yuf

— Cathy Yenca (@mathycathy) June 13, 2018
You can find a list of Cathy's activities here: ​https://list.ly/l/1EF5
The use of the teacher dashboard has always been a great way to provide feedback to students as they complete their activities. In addition to the green and red progress markers for each student, the teacher view will show commonly grouped cards an even the most commonly group incorrect cards (if you made an answer key). A skilled teacher can use these tools to show and hide progress from the class and use the class data to generate discussion that would not be possible without Desmos identifying common groupings. Here the tech, in my opinion does just enough to make these digital card sorts significantly better than their paper cousin without being overly helpful to students. A good card sort will create controversy and force communication rather than allow students to sit quietly at their own computers. Still, the greatest strength of the card sort lies in it's simplicity. All that is needed to provide feedback to your students as they complete their sorts is a projection device (projector or TV) and a view of the dashboard:

Day 35: Someone else posted this last week, and it was a "why didn't I think of that moment." Turned on Desmos anonymous mode and projected the teacher view of our card sort so students could check themselves instead of having to wait on me. #teach180 pic.twitter.com/3QIVKHBJ4W

— Amy McNabb (@amcnabb3) October 12, 2018

Recently, however, many teachers have been asking for a more student-facing approach to providing feedback through the use of the Computation Layer. This up to a few weeks ago was not possible, but as always Desmos came through with the people's requests and released two new features that can be used by anyone to provide feedback in the student view. Check them out here.

Before digging into the use of these new features I do need to say a few things. First, I still mightily prefer to use the projection of the dashboard over providing text based feedback in the student view. Not only is the dashboard feedback much more visually delightful, but it provides a great balance of guess and check vs. productive feedback and keeps the class centrally focused rather than staring at individual screens. Second, it is my opinion (and not necessarily that of Desmos) that if you are planning to use this type of student facing feedback that you enforce a 2 students to 1 computer as strictly as possible. Let's not lose the quality of discussion by allowing students to work silently with an answer key in front of them.

That being said, here are my observations so far:
  1. I am delighted to see the concern teachers have shown not only for preventing the new features as a method of guess and check, but as a detractor to deep thinking and discussion between classmates. quoting Bob Lochel (twitter: @bobloch): "I don't need card sorts to become instant feedback engines. And you are right that I would suddenly see all "green". Rather, I could see pacing students to a card sort, finding a few commonly-missed items, then let them reflect upon individual results."
  2. I am keenly interested to see what comes up as more ways to reveal this feedback are discovered. So far I have seen examples ranging from the use of a subtitle to display the number of correct cards, to keeping the feedback on a separate screen (to be paced to later) to providing a button that will reveal feedback only a given number of times. I can only assume here that it will take many hours in real classrooms to find the correct answer.

For now, here are three options that might be a start:
​(Thank you 
@MeganHeine for the original card sort)
As of right now I am 0% confident that any of these will be close to good solutions, but I am looking forward to seeing what everyone else has to think! I also have another crazy idea that involves using aggregate. Try it out:
10 Comments

Multiple Questions with Random Numbers

9/16/2018

5 Comments


First of all...

I apologize to everyone for the recent lack of new breakout activities or CL webinars.  I'm looking forward to finding some time to work on both soon. In the meantime I thought it would be fun to share some of the most requested things I've encountered while working with teachers and their CL journey.  I'll do this from time to time when I have a few minutes and hopefully you can find it useful.

Before you go any further, try this out:

This activity uses the random generator to create different questions, counting the number of correct answers on a single screen!  It doesn't have to be an addition problem, in fact you can use random numbers to ask basically any question that you can determine correctness for.  If you want to learn how to make something like this, read on. 

This activity can be made in three steps with the use of random numbers, piecewise functions, and capture.  If you are familiar with these you can skip to the end and see how its put together.  Click here to skip.

Random Numbers

The Desmos Computation Layer has an excellent random number generator that can produce random numbers under a variety or circumstances. Check out a few examples below.
the random generator can be made to seed a value once or whenever a specified seed value changes.  Random numbers can also be integers or decimal values.  For more information on how to use the randomGenerator function, visit the computation layer documentation.

Determining Correctness

A piecewise function is used to set up a condition and then output the result. In the first expression below, the function f(x)=sin(x)+1 is graphed between -3π and 3π and f(x)=1 otherwise.
piecewise functions can also be used to output numeric values when given certain conditions.  Try moving the blue point into the circle and observe how the value changes.  You can make a variable like this "I" value to equal one when a correct answer is typed (not necessarily submitted) and zero when it is not.

Capture

Capture saves a numeric value when you press a button or submit an answer. 
Picture
That value can be recalled either as a number or a list of each of the captured values.
Picture


Create Your Activity:

  1. Create your random variables.
    1. What will change from question to question?
    2. Set the parameters to what you want and create the variables in the graph
  2. Create the condition for correctness.
    1. Use a piecewise function to set the conditions.
    2. Have the piecewise function output a value of 1 if the conditions are met and 0 if they are not.
  3. Capture and count your correct answers.
    1. Set up a capture in your submission method (expression input, table, etc) to capture the output of the correctness function.
    2. Create a number list using the history of the capture sink.
    3. Total the list. This value will be the total correct answers.
Picture
Picture
Picture
Picture
Picture

Quick Note on Timing:

If you want a new problem to be presented whenever an answer is given, correct or incorrect, you can set the seeding value of the random number to "submitCount"

If you want a new problem only when a correct answer is given use the correct answer total. You'll need to make sure the value of that variable is zero before the answer is submitted once.

Stuck?

Want to create an activity like this but don't have any ideas?  Check out these samples.  The links to the activities are included below for those that want to look under the hood.
https://teacher.desmos.com/activitybuilder/custom/5b9f5907a772a80b40487a2b

https://teacher.desmos.com/activitybuilder/custom/5b9eeb71d7a4400b3b9a63b5
5 Comments
<<Previous

    Archives

    October 2020
    July 2019
    February 2019
    October 2018
    September 2018
    June 2018
    April 2018
    March 2018

    Categories

    All

    RSS Feed

Proudly powered by Weebly