I am Mr Chow
  • Blog
  • Breakout! Desmos
  • Desmos Activities
  • Lessons

A Fool's Guide to Learning CL

6/22/2018

23 Comments


UPDATE 10/2020:

Picture
So much has changed in the last few years! Instead of reading this, check out the new (less foolish) guide to learning CL here!
Take me to the new guide!
Yesterday we wrapped up a series of 5 webinars introducing people to the computation layer...
​Based on the feedback received people tended to enjoy these webinars.  If you want to take a look at them yourself I'll provide a link later.  We began by going over some interactions for the day and moved on to debugging activities to give people practice with the syntax.  While it is my hope that anyone who participated was able to take something away from it, I have the following advice for someone who wants to learn how to code in Desmos this summer:

STOP!! Don't watch the recordings, instead follow these steps:

1) Start by turning on the Computation Layer in Desmos Labs

Picture

2) Figure  out what you want to do

  • Take out a piece of paper or open a blank document.  Write down some of the things you would like to do with Desmos
  • Look around teacher.desmos.com and find something you want to recreate

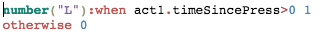
3) Take a look at the documentation

  • Go to https://teacher.desmos.com/computation-layer/documentation and take a look at the basics.  If its confusing for you don't worry! You can play around with the examples there or move on.  You'll be back.

4) Find a Desmos activity and take it apart

There are TONS of prebuilt activities just waiting to be looked at.  Here are a few you might want to check out:
  • Provide delayed feedback by compiling results from one screen onto another: teacher.desmos.com/activitybuilder/custom/57f3dd9dcf3c849008d81007
  • Use sketch to graph relationships in a video with a scrolling line as a guide: teacher.desmos.com/activitybuilder/custom/58797d35d81a612605304b1f
  • Have Desmos graph a function based on input from a table or math expression: teacher.desmos.com/activitybuilder/custom/5605bb5f00701ed10fb09314
  • Play around with time and provide feedback in both the graph and text: teacher.desmos.com/activitybuilder/custom/59233ca25ebd6c10d1af9c05
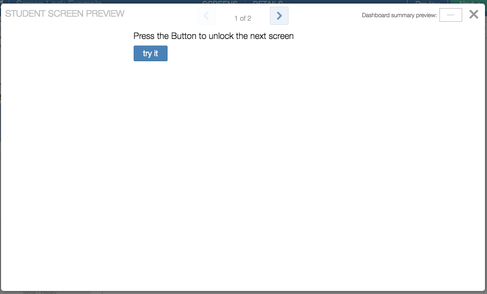
  • Create multiple objects on a single screen using a button: teacher.desmos.com/activitybuilder/custom/56e19b4183ba3908118725dd
Or find one on your own!!!  Looks too complicated?  Take a step back and try a few challenges to increase your skills first.

5) Try some items from the Computation Layer Scavenger Hunt

  • You can find the scavenger hunt here: bit.ly/cl-hunt
  • Try a few basic level challenges, if they are too easy, move on to something harder!
  • Stuck? Check out the solutions here: CL Scavenger Hunt Hints or CL Scavenger Hunt Solutions​

6) Start Building!

  • Use the examples from Desmos, parts of the scavenger hunt, or the CL Bank of Wonders (link coming soon) 
  • ASK QUESTIONS!!! Go to cl.desmos.com and post whatever you need, someone will help out quickly!  

Still stuck? I guess you can watch the webinars or wait for them to start up again soon...

Here: Webinar Recordings .    Just beware, I am just as likely to lead you astray as I am to help.


​

One  More Thing:

The Desmos Fellows (specifically Nick Corley and Jocelyn Dagenais) have put together a bank of Computation Layer interactions that you can drag and drop into your activities as needed.  IT TOTALLY EXISTS!!!

...However, I will hold of on providing a link while it is moved to a better location.  For access now send me a message and I can hook you up, if not I'll Blog about it once it's finalized!  Follow the blog for the best updates.

Update 10.02.20

Have any questions about CL or any related resources? Feel free to email me at mrchowmath@gmail.com or jay@desmos.com
23 Comments

The People Demand Screen Locks!

6/12/2018

1 Comment

 
There have been a lot of questions floating around recently dealing with the breakout activities, specifically how I make the screen locks and control the scoring.  Surprisingly enough, these two aspects are the simplest parts to code.  Here's how:
Picture

Let's Say I want to see this screen with the bouncing ball...

1) Figure out what you want to unlock the next screen.  In this example I want the ball on screen 2 to show when the button on screen 1 is pressed.  
2) In the graph behind the screen you want locked, create a variable.  Use conditionals to set it to 1 when the conditions are met and 0 when they are not (see image below).
Picture
Picture

2) Upload the image you want to block the screen.  In the coordinate for the center put the restriction to have it only show when the condition for unlocking has not been met.  That way the lock screen will disappear when the condition has been met.  You may also want to find a way to keep the image from being moveable.  I like to use a list but that's up to you.
Picture

3) Make sure you uncheck the box in the options to place the image behind the graphs
Picture
...and move your image to the bottom of the list so that it appears on the top layer of the graph.
Picture

4) In the note, make the first line of whatever you want your content to show to be the "screen is locked" message.  Use the conditional that indicates the last screen has not been completed.  You can add whatever you want from line 2 and on.
Picture

5) Even after all of that you will find that your sliders are still visible!
Picture
In order to hide the sliders, add the same condition to each of the points.  This time only having it show after the condition on the last screen has been MET.
Picture

Done!

Picture
​Take a look at the example activity here: https://teacher.desmos.com/activitybuilder/custom/5b200b098a624c7e6c083f8c

How does scoring work?

If you want to figure it out yourself or don't want to have the magic spoiled I wont force you to read the next part...

Read More
1 Comment

Breakout! Desmos.  More Q's than A's

6/8/2018

1 Comment

 
in October of 2017 I had the strangest idea... What if we made the goal of activity to FINISH the activity?  There would have to be challenges along the way, red herrings, and dead ends. I would need to keep the path from beginning to end in a non-linear fashion and give students chances to make mistakes and recover.
Picture
 Yes, I know, it sounded a lot like Labyrinth (R.I.P. David Bowie), but I decided instead to go with an escape room style activity like the ones you see popping up in malls everywhere and in classrooms courtesy of Breakout Edu.  I wanted to make use of all of the tools available in Desmos but found that through the computation layer there were a few components (mainly labs and marble slides) that I would not be able to use to control the path.  Instead I came to the realization that I had stumbled across an idea not meant to create quality lessons as much as use to develop the use of CL. Here's what I came up with
1) Use the card sort concept in a graph to make comparisons.  Make things especially difficult by changing how images move or even what direction they move in.
Picture
2) Use hints in the notes to direct students to different screens in different order.  Additionally, provide riddles or clues so that students can be incorrect and possibly go on to the incorrect screen.
Picture
3) Use random generator to create a quick set of questions that need to be answered.  Additionally, use memes and other fun things to keep students interested.  This screen by far was the screen I was least proud of as it offered very little challenge and room for growth, both for me and my students.
Picture
4) What happens when you go on to a screen early?  Lock the screen of course!
Picture
5) Create interesting interactions like adjusting slope and y-intercept separately to make a line pass through a column in the graph.
Picture
6) Provide a rewarding ending for students... In the first iteration there was no scoring system.  Fun story, a teacher at a workshop I attended tried the activity 8 times to outscore her friend before I told her that points were randomly generated!
Picture
If you want to try this activity you can find it here: 
https://teacher.desmos.com/activitybuilder/custom/5a1e5ed52290ad2d60ee9f27

​
Since that first activity I have released 10 more with multiple variations on each of them.  There are also a few available in French as well!


From a creation standpoint Breakout! Desmos has been invaluable to my lesson creation.   Things like the streak counter, screen locks, unique animations, graph interactions, and even algorithm simplification that I used in real lessons all began here in breakout.  However, it was the popularity of the activities for use in the classroom that caught me off guard.  To make a long story short people started using them! 

This led me to question the quality of the activities themselves.  I have always stressed that these lessons were designed for fun, but I have seen examples of any teachers using them as review or introduction activities.  This prompts me to think back to the Desmos Building Principles and how I can address them in these activities.  How can I create conversation, ask for informal analysis, delay feedback, and allow students to be right and wrong in different and interesting ways?  I spoke with several teachers and a few things came out as successful strategies to implement a breakout! activity:

1) Have students work in groups
2) "Randomize" or mix up groups to make students work with others they are less comfortable with
3) Most importantly, use pause and pacing to encourage discourse in the classroom.

Some teachers like @pejorgens are AMAZING at class discourse, but what about the rest of us?  Here's where I need your help, #MTBoS.  What can we do to make these activities that began just as an exercise in CL into GREAT ACTIVITIES?  More support for teachers via guides and webinars?  Templates or complementary activities to collect student reflections? Alternate forms of these activities that include more reflective questions? What about follow up activities that provide a better student experience than what is given in these breakout activities?  

I also have another request... Whats stopping us from bringing these activities out of the screen? 
​

Desmos Breakout “Escape Room” Activities = Amazing Review https://t.co/RbFix9Cpat S/O @mrchowmath ! #MTBoS #iteachmath @Desmos pic.twitter.com/OvwzVDtiSV

— Cathy Yenca (@mathycathy) April 28, 2018
@mathycathy did a super cool job of breaking students into groups before guiding them through one of the activities and even allowing them to pose for picture after, but I want to make something prepackaged, preferably  digital or printable that again, improves the student experience.  Let me know, #MTBoS, and I can make it for you!
1 Comment

Introducing #improvemyAB

4/17/2018

2 Comments

 
As educators we are constantly looking for ways to improve our instruction.  The increase in digital activities has made content creation a globally collaborative process, but at times we are limited to those within our own networks.  Wouldn't it be great if there were a way to share, improve, and offer feedback to ANYONE creating ANYTHING? Now there is!

Starting something new with @mrchowmath Post your @desmos activity with #improvemyAB to get advice from #MTBoS OR help a friend out by commenting on their activity! Here’s something to start: https://t.co/mmWkNfe3CE

— Kathy H (@kathyhenderson) April 17, 2018
Need help or advice creating an activity?  post finished or unfinished activity with #improvemyAB on twitter and watch the feedback roll in!  The more we collaborate, the better we get.
2 Comments

Sometimes Models Don't Work Out... Sometimes They Do

4/10/2018

1 Comment


This past January, Michael Fenton and Dan Meyer challenged Hawaii teachers to improve our modeling tasks.

Using an NCTM article that Dan wrote as the base, we were introduced to the five student actions that take place in modeling:
  1. Identify variables
  2. Formulate models
  3. Perform operations
  4. Interpret results
  5. Validate conclusions
As highlighted in the article, we were challenged to improve our modeling tasks by taking a closer look at actions 1,2, and 5 specifically. After considering my assumptions that (1) middle schoolers need to be given something that interests them immediately and (2) middle schoolers have a relatively small worldview (especially in my rural community), I arrived at the following task:
​

1. Identify Variables

To start, I displayed the following picture:
Picture
For anyone who doesn't know, this is a picture of Manute Bol who to my knowledge is either the tallest or second tallest player in NBA history.  I chose this image in particular because first of all, I was confident (and correct) that my students did not know who this was and secondly that in this picture Bol is not in an NBA uniform (so he couldn't be googled easily).

We did a "notice and wonder" about the picture and got surprisingly good results.  Students noticed that (1) this must have been a long time ago (not necessarily true), (2) that he was much taller than the referee, and (3) that it looked like his heat was only a foot under the basket.  

The top two "wonders" and the question we ended up answering in most of the classes were (1) "How high could he reach without jumping?" and (2) "Could he dunk without jumping?".  The class IMMEDIATELY jumped to answer the second question with an enthusiastic "yes!" before I posed the question "How do you know that he Isn't just standing much closer to the camera?".  In the end the predictions were about 50-50.

Based on their observations we were able to gather some information that students found helpful.  Students asked and we determined his height to be 7'7" and many students gave the suggestion of using one or more of the tallest kids in class to compare height vs. standing reach.
Picture

2.  Formulate Models

Rather than just use one or two students per class I gave each student the opportunity to measure their own height and standing reach.  Students quickly came up with ideas for relating this to the standing reach of Manute Bol.  Many of them created semi-linear relationships comparing height and standing reach, but a few students went through each data point and found the ratio of height to standing reach and used a proportional relationship to find Manute Bol's height (which led to a good headache discussion about which was easier... separate post).  I sent them home over the weekend to get their answers and did not formally introduce the concept of scatter plots until the following Monday (This is where the aspirin came in).  Using whatever model they wanted (proportional relationships, scatter plots and trend lines, etc.) they then had another night to get an exact answer.

5.  Validate Conclusions

After completing their models and calculations and interpreting the results into conclusions I thought I would use the fact that Manute Bol had unusually long arms to show how this model FAILED.  We looked up Manute Bol's standing reach and found it to be 125" to make our prediction, then I loaded all of the class information into desmos and ran a regression
I was both delighted and horrified to find that based on our model, Manute Bol's standing reach was 124.92". The model worked!!  To counteract these findings I needed to find other NBA players and find their standing reaches as well.  Yao Ming and Shaq were close, but others like Dwight Howard, Lebron James, and Stephen Curry were not close at all.  we used these results to conclude that different people have different arm lengths and that this model would not always be correct.


Findings

  1. It was useful to use an image that students would not be able to find
  2. Allowing students to come up with a strategy on their own was very beneficial
  3. Not instructing students to use a scatter plot as a model created a number crunching headache
  4. Have a back up ready in the event that your model that is designed to fail actually succeeds in your example!

If you want the resources I used to complete this activity you can find them on my lessons page here. 
1 Comment
<<Previous
Forward>>

    Archives

    October 2020
    July 2019
    February 2019
    October 2018
    September 2018
    June 2018
    April 2018
    March 2018

    Categories

    All

    RSS Feed

Proudly powered by Weebly