This past January, Michael Fenton and Dan Meyer challenged Hawaii teachers to improve our modeling tasks.
Using an NCTM article that Dan wrote as the base, we were introduced to the five student actions that take place in modeling:
- Identify variables
- Formulate models
- Perform operations
- Interpret results
- Validate conclusions
1. Identify Variables
To start, I displayed the following picture:
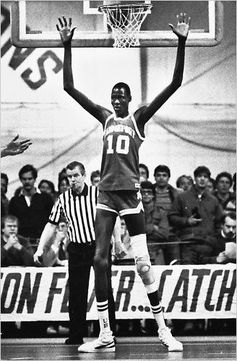
For anyone who doesn't know, this is a picture of Manute Bol who to my knowledge is either the tallest or second tallest player in NBA history. I chose this image in particular because first of all, I was confident (and correct) that my students did not know who this was and secondly that in this picture Bol is not in an NBA uniform (so he couldn't be googled easily).
We did a "notice and wonder" about the picture and got surprisingly good results. Students noticed that (1) this must have been a long time ago (not necessarily true), (2) that he was much taller than the referee, and (3) that it looked like his heat was only a foot under the basket.
The top two "wonders" and the question we ended up answering in most of the classes were (1) "How high could he reach without jumping?" and (2) "Could he dunk without jumping?". The class IMMEDIATELY jumped to answer the second question with an enthusiastic "yes!" before I posed the question "How do you know that he Isn't just standing much closer to the camera?". In the end the predictions were about 50-50.
Based on their observations we were able to gather some information that students found helpful. Students asked and we determined his height to be 7'7" and many students gave the suggestion of using one or more of the tallest kids in class to compare height vs. standing reach.
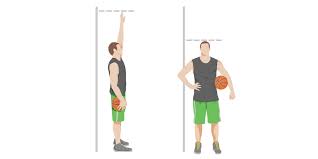
2. Formulate Models
Rather than just use one or two students per class I gave each student the opportunity to measure their own height and standing reach. Students quickly came up with ideas for relating this to the standing reach of Manute Bol. Many of them created semi-linear relationships comparing height and standing reach, but a few students went through each data point and found the ratio of height to standing reach and used a proportional relationship to find Manute Bol's height (which led to a good headache discussion about which was easier... separate post). I sent them home over the weekend to get their answers and did not formally introduce the concept of scatter plots until the following Monday (This is where the aspirin came in). Using whatever model they wanted (proportional relationships, scatter plots and trend lines, etc.) they then had another night to get an exact answer.
5. Validate Conclusions
After completing their models and calculations and interpreting the results into conclusions I thought I would use the fact that Manute Bol had unusually long arms to show how this model FAILED. We looked up Manute Bol's standing reach and found it to be 125" to make our prediction, then I loaded all of the class information into desmos and ran a regression
I was both delighted and horrified to find that based on our model, Manute Bol's standing reach was 124.92". The model worked!! To counteract these findings I needed to find other NBA players and find their standing reaches as well. Yao Ming and Shaq were close, but others like Dwight Howard, Lebron James, and Stephen Curry were not close at all. we used these results to conclude that different people have different arm lengths and that this model would not always be correct.
Findings
- It was useful to use an image that students would not be able to find
- Allowing students to come up with a strategy on their own was very beneficial
- Not instructing students to use a scatter plot as a model created a number crunching headache
- Have a back up ready in the event that your model that is designed to fail actually succeeds in your example!
If you want the resources I used to complete this activity you can find them on my lessons page here.
 RSS Feed